Rewrite of Glenn Berry’s missing index warning query for multi-database use

I am a big fan of Glenn Berry’s SQL Server Diagnostic Information Queries. One of the queries identifies the top 25 “missing index warnings for cached plans in the current database.” (As of the October 2015 version, this is Query 61 in the SQL Server 2014 query file, and an identical query exists for each of the versions.) The query is as follows:

SELECT TOP(25) OBJECT_NAME(objectid) AS [ObjectName], 
               query_plan, cp.objtype, cp.usecounts
FROM sys.dm_exec_cached_plans AS cp WITH (NOLOCK)
CROSS APPLY sys.dm_exec_query_plan(cp.plan_handle) AS qp
WHERE CAST(query_plan AS NVARCHAR(MAX)) LIKE N'%MissingIndex%'
AND dbid = DB_ID()
ORDER BY cp.usecounts DESC OPTION (RECOMPILE);

Note that the query executes a cross apply to sys.dm_exec_query_plan, which returns the context database ID associated with the plan, and the query then filters by database ID. So SQL Server must evaluate the query for all plans in the cache, and then return only the ones for the current database.

I have found that I sometimes want to run this for several databases, but it’s a lot of overhead to run this same query several times, each time filtering to the current database. I decided to do a rewrite so that I only need to run the query one time:

WITH MissingIndexWarnings AS
(
	SELECT	db.name [Database Name],
			OBJECT_NAME(objectid, dbid) AS [ObjectName], 
			query_plan, cp.objtype, cp.usecounts,
			row_number() over (partition by dbid order by cp.usecounts desc) rn
	FROM sys.dm_exec_cached_plans AS cp WITH (NOLOCK)
	CROSS APPLY sys.dm_exec_query_plan(cp.plan_handle) AS qp
	inner join sys.databases db on qp.dbid = db.database_id
	WHERE CAST(query_plan AS NVARCHAR(MAX)) LIKE N'%MissingIndex%'
)
SELECT	miw.[Database Name],
		miw.ObjectName,
		miw.query_plan,
		miw.objtype,
		miw.usecounts
FROM MissingIndexWarnings miw
WHERE miw.rn <= 25
AND miw.[Database Name] in ('Database1', 'Database2', 'Database3')
ORDER BY miw.[Database Name], miw.usecounts DESC OPTION (RECOMPILE);

Obviously, the idea is to replace the list of database names in the WHERE clause. As a side benefit, this allows you to run the query for a database where the compatibility level is 80. The original query generates an error if executed in the context of an 80 database, but with the rewrite, you can switch to a database at a higher compatibility level (for instance, master) and filter to the desired database name.

United States geographic data: States and counties

I have been interested in SQL Server’s geography data type since its implementation beginning in SQL Server 2008. I store most of my GPS data (primarily track data from my travels) in a SQL database. While it nice to be able query against the data and have the visualizer display a track, that track lacks a lot of visual context about where it actually is.

I have long wanted to obtain basic shape data of states and counties so that I could select against that data in addition to my track data to provide just that context. However, I had difficulty getting the shape data in SQL format and so would quickly abandon the idea. A few months ago I bit the bullet and converted some publicly accessible sources. I believe that I obtained the state-level from this link, and the county data from here.  I had to write a program to extract the data from the KML and convert it to a format that could be loaded into SQL Server.

The purpose of this post is to share that data in SQL Server format. The attached files contain insert statements to add geographic data into tables.

There are some slight anomalies in the data between the county-level data and state-level data.  For instance, Miami County, Kansas, sits on the far eastern edge of the state and borders with Missouri.  If you select the data for Miami County and union it with the data for Missouri, you will observe a slight overlap.

declare @miamiCounty geography = (select Boundaries from PoliticalRegion where RegionName = 'Miami' and ParentRegionName = 'Kansas' and Type = 'County');
declare @missouriState geography = (select Boundaries from PoliticalRegion where RegionName = 'Missouri' and Type = 'USState');
 
select @miamiCounty
union all
select @missouriState;

This can also be seen by performing an intersection operation on the data:

declare @miamiCounty geography = (select Boundaries from PoliticalRegion where RegionName = 'Miami' and ParentRegionName = 'Kansas' and Type = 'County');
declare @missouriState geography = (select Boundaries from PoliticalRegion where RegionName = 'Missouri' and Type = 'USState');
 
select @miamiCounty.STIntersection(@missouriState).STArea();

This indicates an overlap of 9,145,460 square meters, or about 3.5 square miles.

Also, I observe that some states just have some strange things in their boundaries.  For instance, the data seems to imply that the Fox River and Lake Winnebago in Wisconsin is not actually part of Wisconsin.  Perhaps there is some reason for the data being like this, but I claim ignorance on that subject.

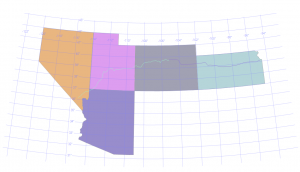
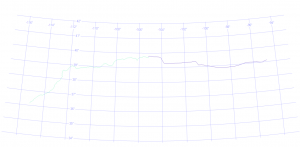
Regardless, the data is more than adequate for my purposes.  For instance, about a year ago I drove from Kansas City to Las Vegas. When I select the raw data I can generate this visualization:

VegasTripWithoutStates

(Sorry for the lightness of the image; click on it to enlarge.) We have the latitude and longitude lines as reference points. Only because I know what the data represents, I can tell that Kansas City is at the right end of the line, and Las Vegas is at the left end of the line, and that since I stayed the night in Denver, that represents the point in the middle where the line changes color. Without this previous knowledge, however, it would be difficult to place the line.

When I add state data into the query (via a union), the picture becomes much clearer:

VegasTripWithStates

Here is the data. It is written as a series of inserts that should go into a table defined as:

CREATE TABLE [dbo].[PoliticalRegion](
	[PoliticalRegionId] [int] NOT NULL IDENTITY(1,1),
	[RegionName] [nvarchar](255) NOT NULL,
	[Type] [nvarchar] (30) NOT NULL,
	[ParentRegionName] [nvarchar] (255) NULL,
	[Boundaries] [geography] NOT NULL
);

Now, here is a problem that you are likely to run into. The insert script is about 41 MB in size, and even on machines with plenty of horsepower I run into problems getting a file that large to load into SSMS and execute. A workaround that has been successful for me is to load the script via sqlcmd. For example, assuming you are using integrated security, a command like the following works for me:

sqlcmd -S serverName -d databaseName -E -i PoliticalRegionInserts.sql

I have tested this successfuly on both SQL Server 2008 and 2014.

Note: The state-level data includes the 50 states plus the District of Columbia but does not include any territories. The county-level data includes the 50 states, the District of Columbia, plus Puerto Rico.

SQL Server 2016 CTP2 Initial Impressions: Temporal Table Performance

One of the interesting new features that I came across within CTP2 of SQL Server 2016 are the new Temporal Tables, which essentially give you the ability to see your records from a point in time perspective. My hope was to see something that gave me an easier to use Change Data Capture like feel, and I was specifically hoping it would be with that sort of performance that CDC gives you. What I found was not quite that.

Here is the setup: First I would like to create a baseline table. This will not be Temporal, it is just to compare the results between a Temporal table and a normal table.

CREATE TABLE nottemporal
(
id INT IDENTITY(1, 1) PRIMARY KEY CLUSTERED
,col1 VARCHAR(200)
,col2 DATETIME2
,col3 INT
);

Next, I will create my temporal table. It will have the same structure as my non Temporal table but with the required fields that essentially make a table Temporal.

CREATE TABLE testtemporal
(
id INT IDENTITY(1, 1) PRIMARY KEY CLUSTERED
,col1 VARCHAR(200)
,col2 DATETIME2
,col3 INT
,SysStartTime DATETIME2 GENERATED ALWAYS AS ROW START NOT NULL
,SysEndTime DATETIME2 GENERATED ALWAYS AS ROW END NOT NULL
,PERIOD FOR SYSTEM_TIME (SysStartTime, SysEndTime)
) WITH (SYSTEM_VERSIONING = ON);

The syntax is a bit different than what we would normally use within SQL Server, and it is required in order to make these Temporal Tables work. It is also worth noting that things look a bit different for a Temporal table within Management Studio. You will see that we have a little note that says it is System-Versioned and then when you expand the table there is a reference to the default History table that is created for us that contains this data. You can create your own table (so that it is named nicely) but that is for another time.

Temporal Table Object Explorer

Now I want to populate this table. Before doing that we need a numbers table to simplify things, plus Adam Machanic tells us that we require one! If you create your numbers table with 1 million rows and just like Adam tells us here, my scripts will work for you without any changes.

For reference, I am running all of these on an Azure VM created with the SQL 2016 CTP2 image with 4 cores and 3.5 GB of RAM. Pretty puny but it will do for this.

>SET STATISTICS IO ON;
SET STATISTICS TIME ON;
 
INSERT INTO testtemporal(col1, col2, col3)
Select 'test data ' + cast(number as varchar(10))
,dateadd(ss, number, getdate())
,number
From numbers;
GO
 
INSERT INTO nottemporal(col1, col2, col3)
Select 'test data ' + cast(number as varchar(10))
,dateadd(ss, number, getdate())
,number
From numbers;
GO

From a time perspective these two ran in roughly the same amount of time and obviously there will be slightly higher IO for the Temporal table, since it has a couple of extra columns, if nothing else.

For the Non Temporal Table:

Table 'nottemporal'. Scan count 0, logical reads 28318, physical reads 0, read-ahead reads 0, lob logical reads 0, lob physical reads 0, lob read-ahead reads 0.
Table 'Numbers'. Scan count 1, logical reads 1615, physical reads 0, read-ahead reads 0, lob logical reads 0, lob physical reads 0, lob read-ahead reads 0.
SQL Server Execution Times:
CPU time = 7812 ms, elapsed time = 57097 ms.

For the Temporal Table:

Table 'testtemporal'. Scan count 0, logical reads 38198, physical reads 0, read-ahead reads 0, lob logical reads 0, lob physical reads 0, lob read-ahead reads 0.
Table 'Numbers'. Scan count 1, logical reads 1615, physical reads 0, read-ahead reads 0, lob logical reads 0, lob physical reads 0, lob read-ahead reads 0.
SQL Server Execution Times:
CPU time = 7844 ms, elapsed time = 58777 ms.

But it is when we start updating that this gets interesting. In this case, I am going to update all 1 million rows. Perhaps not a real-world scenario, but it is the best way to show what I see as a concern.

>Update testtemporal
set col1 = 'Modified Data ' + cast(col3 as varchar(10));
GO
Update nottemporal
set col1 = 'Modified Data ' + cast(col3 as varchar(10));

For the Non Temporal Table:

Table 'nottemporal'. Scan count 1, logical reads 61298, physical reads 0, read-ahead reads 0, lob logical reads 0, lob physical reads 0, lob read-ahead reads 0.
SQL Server Execution Times:
CPU time = 8766 ms, elapsed time = 42353 ms.

For the Temporal Table:

Table 'MSSQL_TemporalHistoryFor_565577053'. Scan count 0, logical reads 15993, physical reads 0, read-ahead reads 0, lob logical reads 0, lob physical reads 0, lob read-ahead reads 0.
Table 'testtemporal'. Scan count 1, logical reads 83217, physical reads 0, read-ahead reads 0, lob logical reads 0, lob physical reads 0, lob read-ahead reads 0.
SQL Server Execution Times:
CPU time = 31109 ms, elapsed time = 68449 ms.

This is where it gets interesting from an IO/Time perspective. Realizing that Time is one of those things that you cannot bank on, it is a noticeable jump here though quite obviously YMMV. Comparable to having a trigger on the temporal table, I would say (without real data to back that up…just a feeling). 68 seconds to update that Temporal table vs 42 seconds to update the non Temporal table.

The reads are higher, but it is not significant … not yet anyway.

Seeing how poorly that was on the first update, I figure it is worth checking to see what would happen if I go and update those records again back to what they were before.

>Update testtemporal
set col1 = 'test data ' + cast(col3 as varchar(10));
GO
Update nottemporal
set col1 = 'test data ' + cast(col3 as varchar(10))

And the IO/Time data for this gets even crazier.

For the Non Temporal Table:

Table 'nottemporal'. Scan count 1, logical reads 11165, physical reads 0, read-ahead reads 0, lob logical reads 0, lob physical reads 0, lob read-ahead reads 0.
SQL Server Execution Times:
CPU time = 5063 ms, elapsed time = 15502 ms.

For the Temporal Table:

Table 'MSSQL_TemporalHistoryFor_565577053'. Scan count 0, logical reads 3242447, physical reads 0, read-ahead reads 3, lob logical reads 0, lob physical reads 0, lob read-ahead reads 0.
Table 'testtemporal'. Scan count 1, logical reads 15156, physical reads 0, read-ahead reads 0, lob logical reads 0, lob physical reads 0, lob read-ahead reads 0.
SQL Server Execution Times:
CPU time = 66359 ms, elapsed time = 165560 ms.

This is where it went nuts, in my opinion. We see the IO on the History table jump up from 15,000 for that first update to over 3 million on the second (and as I later found out a number of updates after that) and the time to complete was an order of magnitude higher. Obviously, from a performance perspective this could be problematic.

Digging into the why of this, it was pretty clear by just looking at the structure of that History table that SQL creates for us. The clustering key is built on our own Primary Key, but it also adds on the SysStartTime and SysEndTime datetime2 values.

Temporal Table Clustering Keys

And then running a quick DBCC SHOWCONTIG to see how things are laid out after those updates, we see that there is a fair amount of Fragmentation, as would be expected for a clustering key of this nature.

DBCC SHOWCONTIG scanning 'MSSQL_TemporalHistoryFor_565577053' table...
Table: 'MSSQL_TemporalHistoryFor_565577053' (597577167); index ID: 1, database ID: 5
TABLE level scan performed.
- Pages Scanned................................: 12149
- Extents Scanned..............................: 1520
- Extent Switches..............................: 7212
- Avg. Pages per Extent........................: 8.0
- Scan Density [Best Count:Actual Count].......: 21.06% [1519:7213]
- Logical Scan Fragmentation ..................: 99.99%
- Extent Scan Fragmentation ...................: 0.79%
- Avg. Bytes Free per Page.....................: 2256.4
- Avg. Page Density (full).....................: 72.12%
DBCC execution completed. If DBCC printed error messages, contact your system administrator.

In summary, Temporal tables look like they could be a very cool feature for the next and future releases of SQL Server. But they will definitely be coming with a price.

UPDATE 7/20/2015: Tested on CTP 2.1 with identical results.

UPDATE 9/30/2015: Tested on CTP 2.4 with similar results.
SQL Server 2016 CTP2 Initial Impressions: Live Statistics and Dynamic Data Masking

I have been trying out the CTP2 release that came out a couple of days ago and wanted to write about a couple of things I’ve seen so far.

First, I kind of like the Live Query Statistics feature.  The first time that I ran a query with live statistics everything seemed to hang up for about four minutes, displaying a message to the effect that it was preparing the query.  I’m guessing this more a function of initializing stuff under-the-hood on the underpowered VM that I’m using, because subsequent processing has been much speedier.

In the few queries that I’ve tested out so far, there hasn’t been too much excitement, but can certainly see how live statistics can be a useful diagnostic tool at times.

I also tried playing around with Dynamic Data Masking.  Unfortunately, I wasn’t able to get things to work even using the sample given on the page.  Specifically, the line:

ALTER TABLE Membership ALTER COLUMN FirstName ADD MASKED WITH (FUNCTION = 'partial(1,"XXXXXXX",0)');

results in an error:

Msg 102, Level 15, State 1, Line 8
Incorrect syntax near 'masked'.

The syntax appears to be correct according to the ALTER TABLE documentation, so I’m not sure if the syntax has been changed or if something isn’t quite working correctly in SQL Server.

One more thing.  When I install Management Studio, one of the first things I change is the setting to send the results to a new tab and to automatically switch to the new tab when query execution is done (Tools -> Options -> Query Results -> SQL Server -> Results to Grid).  To my annoyance, queries execute fine, but SSMS does not automatically switch to a new tab.  This happens even after a restart of SSMS.  However, I have not yet tried this on a different installation.

All that said, I really like a lot of the new features in SQL Server 2016 and look forward to further experimentation.

UPDATE:  It turns out that a pair of trace flags needed to be enabled in CTP 2.0 for the dynamic data masking to work correctly.  Starting in CTP 2.1, these trace flags were enabled by default and the sample code works as expected.

As of CTP 3.0, the switch to results tab features is still not working in Management Studio.  I have submitted a Connect item to address this bug.

UPDATE: Awesome! As of CTP 3.1, switch to results tab looks to be working!

NUMS table creation performance

There is a Stack Overflow posting from 2009 that addresses different ways to create a NUMS table.  The accepted answer from poster KM gives a fascinating summary of seven different ways to accomplish this, including a performance test for creating 10,000 values.  I was curious to know how these different methods scaled into the 1,000,000 value range.

To this end, I created a program that created NUMS tables of various sizes and recorded the time required.  The methodology is same as that used by KM:  for methods 1 and 2, four runs are executed; for the remaining methods, eleven runs are executed.  In each case, the slowest run is discarded and the remaining times are averaged for the final result.  (Yes, one could make the case that a “cold cache” run is more applicable to real world situations, but this methodology will suffice for the purposes of this test.)

A couple of notes about the individual methods.  KM made an error in Method 1 by creating 100,000 values instead of 10,000.  Method 1 is generally the slowest of the lot, both in my tests and in KM’s test, but not by as much as KM’s test indicates.  It is pretty much on-par with Method 2.

Method 3 uses a recursive common table expression to execute a single insert into the NUMS table.  Recursive CTEs are limited to 32,767 iterations, so this method will not work for larger NUMS tables.  Accordingly, the program will skip method 3 if the number of values exceeds 32,767.

Method 4 is limited to creating NUMS tables with 2n values, where n is an integer, so the program will select a value of n that results in at least the requested the number of records.  In most cases, this will generate a NUMS table with significantly more values than the other methods.

For Method 5, I included an additional “Pass” CTE so that it is capable of generating up to about 4.3 billion values.  Similarly, Method 7’s script was modified to include two additional self-joins to ensure that even with databases with a minimal number of sys.objects records will be capable of generating at least 1,000,000 records.

I also removed the code from each method that relates to calculating the timing, and instead captured that information externally from the scripts.  Creating and dropping the NUMS table is also handled externally; however, the scripts still include the ALTER TABLE statements to add the clustered primary key index.

These tests were executed in July 2013 on a Dell R900 server with a good I/O subsystem.  I get quite different results on desktop systems, and I don’t have any results from other server systems, so bear that limitation is mind and take these results with a grain of salt.

Here are the timing results, in seconds, for each of the seven methods for 10,000 numbers, 25,000 numbers, 100,000 numbers and 1,000,000 numbers:

NumsPerfSummaryTable

NumsPerfMethods1-2Graph  NumsPerfMethods3-7Graph

Clearly, the best performer is Method 7, as KM also found.

It is useful to scale the results of the second graph.  I scaled the y-axis to show the time required to generated 1,000,000 records.  For instance, Method 7 took 0.062431 seconds to create 10,000 records, so at this same rate it would take 6.2431 seconds to generate one million numbers.  I also scaled the x-axis logarithmically.

NumsPerfMethods3-7GraphScaledLog

From this, it is apparent that Method 4 shows the best improvement at larger scales, and may well perform better than the other methods at much larger scales than 1,000,000 records.

One final note.  While Method 7 out-performs the other methods in this test, it and Method 6 have the disadvantage of being dependent on system tables that exist for quite different purposes.  While it seems unlikely that these methods will stop working for any future service pack or version of SQL Server, something just bugs me about this system table “abuse.”  My personal favorite is Method 5.  It performs reasonably well, and with the addition of a “Pass6” CTE, it can be capable of generating massive NUMS tables (beyond the reach of the BIGINT limit).  However, it does have the problem of being a bit “clunky” as code, and its purpose may not be readily apparent by those come along later.

Emulating Excel’s NORMDIST in T-SQL

This is something that came up at work recently.  A user wanted to migrate a report from Excel to SSRS and needed to be able to implement the NORMDIST function in T-SQL.  NORMDIST takes four parameters:

  • x, a number indicating the value of interest on the normal distribution curve
  • mu, a number indicating the sample mean
  • sigma, a number indicating the sample standard deviation
  • cumulative, a boolean indicating whether to compute the cumulative value of the normal distribution curve (in other words, the integral of the normal distribution from negative infinity to x). For what I have done here, I am assuming that cumulative is TRUE.  The results for cumulative = FALSE will be completely different.

My statistics knowledge is, to say the very least, quite rusty, but with the help of a couple of Wikipedia pages (this and this), I came up with the following T-SQL that (at least for a smattering of value I tested) comes pretty close to the Excel NORMDIST function.

-- Initialize parameters
declare @x float = 1.5;
declare @mu float = 0.0;
declare @sigma float = 1.0;
 
-- Compute NORMDIST
declare @erfx float = (@x - @mu) / sqrt(2.0 * power(@sigma, 2.0));
declare @sign float = sign(@erfx);
select @erfx = abs(@erfx);
 
declare @t float = 1.0 / (1.0 + 0.3275911 * @erfx);
declare @erf float = @sign * 
	(1.0 - (0.254829592 * @t - 0.284496736 * power(@t, 2.0) +
	1.421413741 * power(@t, 3.0) - 1.453152027 * power(@t, 4.0) +
	1.061405429 * power(@t, 5.0)) * exp(-power(@erfx, 2.0)));
declare @normDist float = 0.5 * (1.0 + @erf);
select @normDist;

Of course, the usual caveats apply.  Be sure to validate this script against Excel for any values of interest, and please let me know if you find any errors in the results.

A final tip:  Tempting as it may be, don’t implement this as a user-defined function.  Scalar UDFs really are quite bad for performance.

COUNT DISTINCT not supported in a windowing context (not documented)

As a trivial example, consider the following dataset:

CountDistinctSalesDataset

Suppose we need to determine the number of customers associated to employee, and we need this result for each row in a report in we are generating.  (The report computes other columns of interest, such as a running total, that we will ignore in this post.)

We could write this as follows:

select	EmployeeName,
	count(CustomerName) over (partition by EmployeeName) CustomerCount
from	Sales;

This works fine for Bob, but for Alice it incorrectly returns a value of 3.  This, of course, happens because Alice is associated with Eve on two different sales.

CountDistinctIncorrectResult

It seems simple and logical to add the distinct keyword:

select	EmployeeName,
	count(distinct CustomerName) over (partition by EmployeeName) CustomerCount
from	Sales;

The first time that I tried this was on a SQL Server 2008 system running at SP2, and it generated the following error:

Msg 102, Level 15, State 1, Line 2
Incorrect syntax near 'distinct'.

On a SQL Server 2008 system at SP3, the following improved error is generated instead:

Msg 10759, Level 15, State 1, Line 2
Use of DISTINCT is not allowed with the OVER clause.

The same error happens with SQL Server 2008 R2 (SP1) and with SQL Server 2012 (RTM).

As the second error message makes clear, this particular usage is not supported.  This is fine and well, except that this limitation doesn’t seem to documented in Books Online, at least not under the COUNT or OVER topics for these three versions of SQL Server.

Hekaton concurrent updates: Large vs. small transactions

Here is another experiment that I performed with In-Memory OLTP (Hekaton) on CTP2 of SQL Server 2014.  I started by creating a table and a sequence:

create table Employee
(
	EmployeeId bigint not null
		primary key nonclustered hash with (bucket_count = 20000000),
	Salary money
) with (memory_optimized = on, durability = schema_only);
 
CREATE SEQUENCE EmployeeSequence AS BIGINT
START WITH 1 INCREMENT BY 1;

Next, I added about 10 million records into the table. The EmployeeId was generated from the sequence object and the Salary was a random value from 25,000 to 75,000:

with Records as (select top (216) status from master.dbo.spt_values)
insert	Employee (EmployeeId, Salary)
select	next value for EmployeeSequence as EmployeeId,
	cast(cast(25000.00 + 50000.00 * (abs(cast(binary_checksum(newid()) as int)))
		* 1.0 / 2147483648.0 as int)as money) as Salary
from	Records r1 cross join Records r2 cross join Records r3;

The first few rows looked like this:

EmployeesTop10

I don’t know enough about the internals of Hekaton to be sure how the records in the Employee table are accessed during a table scan (or if there is a deterministic way that they are accessed), but I am making the guess that it happens in EmployeeId order. I set up the following queries in two separate connections:

Connection 1 – Give all employees a 5% raise:

update Employee
set Salary *= 1.05;

Connection 2 – Set a specific salary for a specific employee:

update Employee
set Salary = 80000.00
where EmployeeId = 9999999;

Before running anything, row 9,999,999 looked like this:

Employee9999999Before

I then fired off the query in connection 1 and as quickly as possible switched to connection 2 and executed the statement there. Query 2 completed quickly. The first query ran for a few seconds and then generated an error:

Msg 41302, Level 16, State 110, Line 1
The current transaction attempted to update a record that has been updated since this transaction started. The transaction was aborted.
The statement has been terminated.

The bottom line is that even though query 1 started first and almost surely had done far more work (in terms of number of updates done before it hits the record for employee 9,999,999), nonetheless it gets the short end of the stick and is the “victim” in this case.  At this point, the target employee has this value:

Employee9999999After

This behavior of simply killing off the second transaction involved in a concurrent update in such a fashion is the price that is paid for having no locking.  My concern is that it will limit the usefulness of Hekaton tables for OLTP purposes. I can certainly envision a scenario where a batch update repeatedly fails because small one-off updates taking place across the same set of records will repeatedly cause the larger transaction be to terminated. And batch updates are just a part of life, at least in my experience, for most OLTP systems. That being said, I still envision great utility in using the In-Memory tables in situations where concurrent updates won’t be likely, such as for staging tables.

Hekaton error message is slightly misleading

Let’s take a look at the error message that we receive when we do a concurrent update on an In-Memory OLTP (Hekaton) table. I start by opening a connection and running:

begin transaction
 
update CheckingAccount with (snapshot)
set    Balance = 100.00
where  OwnerId = 123;

This update runs fine. Now, after this first statement completes, I open a second connection and run another update against the same table:

update CheckingAccount
set    Balance = 200.00
where  OwnerId = 123;

Since I have an open transaction in the first connection that has updated the same row, I expect the second attempt to fail. It does, and the error message is:

Msg 41302, Level 16, State 110, Line 1
The current transaction attempted to update a record that has been updated since this transaction started. The transaction was aborted.
The statement has been terminated.

The wording of this error message is a bit misleading, however. Clearly the first update did not happen after the second transaction started, particularly given that the second connection had not yet even been established at that time!

Hekaton – Classic deadlock scenario

Ever since CTP2 was released a few weeks back, I have become interested in the new In-Memory OLTP (aka Hekaton) feature currently being constructed for SQL Server 2014.  Once I learned that Hekaton uses lock-free structures, one of the first things I started to wonder about is how Hekaton handles a classic deadlock scenario.  After downloading and installing the CTP, I created a Hekaton-enabled database and then added a couple of tables:

create table CheckingAccount
(
       OwnerId int not null primary key nonclustered hash with (bucket_count = 1000),
       Balance money
) with (memory_optimized = on, durability = schema_and_data);
 
create table SavingsAccount
(
       OwnerId int not null primary key nonclustered hash with (bucket_count = 1000),
       Balance money
) with (memory_optimized = on, durability = schema_and_data);
 
insert CheckingAccount (OwnerId, Balance) values (123, 1000.00);
insert SavingsAccount (OwnerId, Balance) values (123, 2000.00);

Now in connection 1, I run the following:

begin transaction
 
update SavingsAccount with (snapshot)
set           Balance -= 300.00
where  OwnerId = 123;

In connection 2:

begin transaction
 
update CheckingAccount with (snapshot)
set           Balance -= 200.00
where  OwnerId = 123;

Back in connection 1:

update CheckingAccount with (snapshot)
set           Balance += 300.00
where  OwnerId = 123;

Msg 41302, Level 16, State 110, Line 1
The current transaction attempted to update a record that has been updated since this transaction started. The transaction was aborted.
Msg 3998, Level 16, State 1, Line 1
Uncommittable transaction is detected at the end of the batch. The transaction is rolled back.
The statement has been terminated.

So right there we have the answer to how Hekaton handles this scenario: the second attempt at an update on the same row causes the transaction to fail.

Completing the scenario, switch back to connection 2 and run:

update SavingsAccount with (snapshot)
set           Balance += 200.00
where  OwnerId = 123;
 
commit transaction

Now check the state of the tables:

select ca.OwnerId, ca.Balance CheckingBalance, sa.Balance SavingsBalance
from CheckingAccount ca inner join SavingsAccount sa
on ca.OwnerId = sa.OwnerId where ca.OwnerId = 123;

hekaton-consistency
So the tables are transactionally consistent. Bear in mind that in the classic version of this scenario (using disk-based tables), connection 2 would have been chose as the deadlock victim. It’s OK that in this world the opposite is the case because the rules of consistency don’t dictate who is the “winner” and who is the “loser,” only that end result “balances out.”